Fire FLowers
OVerview

Here, a poi head (A) is depicted as a reference frame that rotates around a hand (O). The basis of our analysis depends on the fact that the force of gravity varies in the form of a sine wave over time with respect to the poi head reference frame. This is because gravity is a constant force in the downward direction (in line with jhat_O) and the accelerometer is in line with jhat_A, which is spinning with respect to jhat_O. The jhat_O component of jhat_A fluctuates with sin(t). Below, we explain how we detect the frequency of the sine wave.

Process
While the poi is spinning, the following actions loop continuously:
-
The Arduino streams accelerometer data from the spinning poi to MATLAB.
-
Windowing: A MATLAB script selects the current timestep of data, as well as the 80 previous timesteps (2 previous seconds).
Frequency analysis: The MATLAB script converts the accelerometer data to the frequency domain, and picks out the highest data point, which corresponds to the main spinning frequency.
Windowing

To detect the spinner’s beat, we can’t simply analyze the current state of the poi, we need acceleration data over time to analyze. So, we select a trailing “window” in real-time. As the poi spins, acceleration data is continuously queued into one MATLAB variable. At each analysis timestep, we select the last 80 values, which corresponds to the last 2 seconds.
The length of the window affects the analysis. The smaller the window, the quicker the algorithm responds to changes in spinning frequency. The larger the window, the more resistant the analysis is against corruption from random noise. The two-second window is a balance of the two.
Frequency analysis


The Discrete Fourier Transform is an [n-by-n] matrix whose column vectors correspond to sine waves:

The matrix is arranged
[v1 v2 v3 … vn]
such that the column vectors; sine waves vary in frequency.
When a discrete signal which varies with respect to time is projected onto it, the signal undergoes a change of basis into the frequency domain:
A = Wx
where W is the DFT matrix, x is the data, and a is a matrix of weights which corresponds to the prevalence of each frequency of sine wave.
Thus, we can easily deduce the frequency at which the poi is spinning: it is the highest value in the frequency-domain data (besides the value at zero, which corresponds to the graph’s y-axis offset).
Matlab comes equipped with the powerful function fft, which is a specific algorithm of the Discrete Fourier Transform.
In practice, we use the MATLAB function fft, which uses the Fast Fourier Transform, a specific algorithm which computes the Discrete Fourier Transform of a sequence.
Results
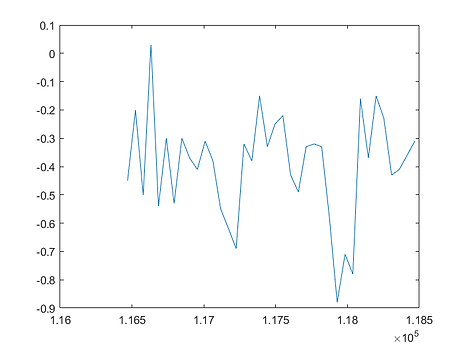
This graph shows the acceleration in the z direction over a 2 second window
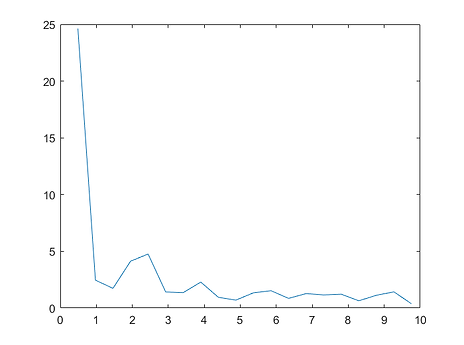
This is the graph of the DFT taken over a 2 second window
Here is a gif of the DFT being taken in real time as Florian spins the poi with the accelerometer
Circuit Diagram

(Future step) LED mapping

When the spinning frequency is identified, the Arduino lights up the LEDs according to said frequency.